guides
The Problem: Guessing Kafka Cluster Size
Most Kafka clusters start with a guess. Someone picks 3 brokers because "that's what the tutorial used," and six months later the team is firefighting disk full alerts at 2 AM.
Proper capacity planning requires calculating across four independent dimensions — throughput, storage, partitions, and fault tolerance — and sizing to the largest. Get any one wrong and you'll hit a bottleneck.
We built the Kafka Capacity Planner to make this math instant.
How the Calculator Works
The planner implements the same 5-step sizing methodology used by Kafka administrators at enterprises running thousands of brokers. Enter your workload parameters, and it calculates the optimal cluster size in real time.
The Four Dimensions
Every Kafka cluster is constrained by four independent dimensions. You must calculate all four and size to the maximum:
| Dimension | What Drives It | Bottleneck Sign |
|---|---|---|
| Throughput | Message rate × size × replication | Producer latency > 100ms |
| Storage | Throughput × retention period | Broker disk usage > 70% |
| Partitions | Consumer parallelism + ordering | Slow rebalances, high latency |
| Fault tolerance | Replication factor + failure headroom | Cannot survive broker loss |
The calculator evaluates all four and tells you which one is driving your broker count.
Step 1: Choose a Preset or Enter Custom Values
Start with one of the five built-in presets that match common workloads:
- Stock Exchange — 800K msgs/sec peak, 400-byte messages, 8 consumer groups
- IoT / Telemetry — 2M msgs/sec peak, small 128-byte messages, 14-day retention
- Log Aggregation — 200K msgs/sec peak, larger 2KB messages, 30-day retention
- E-commerce Events — 500K msgs/sec peak, 512-byte messages, 7-day retention
- Custom — blank slate for your exact numbers
The key inputs are:
- Peak message rate — not your average, but the spike your cluster must handle during volatile periods. This is the most important number.
- Average message size — sample from your actual topics or estimate from your schema.
- Replication factor — always 3 for production. Never less for critical data.
- Retention period — driven by business or regulatory requirements (e.g., SEBI requires 7 days for financial data).
- Consumer groups — count every application that reads from Kafka (surveillance, risk, settlement, analytics, etc.).
- Max consumer parallelism — your Spark Streaming executor count × cores, or equivalent.
Step 2: Customize Your Hardware (Optional)
Click Broker Hardware Spec to expand the hardware configuration. The defaults represent a typical production setup:
- 128 GB RAM
- 24 vCores
- 12 × 12 TB NVMe SSDs (JBOD)
- 10 GbE NIC
But if your environment is different — maybe you have 6 × 4 TB HDDs, or 25 GbE networking — change these values and watch the broker count adjust. The calculator derives three critical capacities from your hardware:
- Usable storage per broker = disk count × disk size × 85% (formatted capacity)
- NIC throughput = NIC speed × 120 MB/s per GbE
- Safe throughput per broker = 67% of NIC capacity (headroom for spikes)
Step 3: Read the Results
The results panel shows four metric cards:
- Brokers — the minimum number needed, with the bottleneck dimension highlighted
- Total Storage — cluster-wide storage requirement including 30% headroom
- Network Throughput — total cluster network load (inbound + outbound + replication)
- Total Partitions — based on the higher of consumer parallelism or throughput per partition
Understanding the Bottleneck
The colored insight box tells you what's driving the broker count:
- Fault tolerance (blue) — your workload fits comfortably. Brokers are driven by the minimum needed to survive failures, not resource pressure. This is common for lighter workloads.
- Storage (amber) — retention × replication × throughput exceeds what your disks can hold. Solutions: shorten retention, enable tiered storage, or use larger disks.
- Throughput (amber) — consumer groups multiply read traffic. With 8 consumer groups, outbound traffic is 8× your inbound. Solutions: faster NICs, compression, or fewer consumer groups.
- Partitions (amber) — high consumer parallelism requires many partitions. Review whether all consumers truly need that level of parallelism.
Step 4: Tune the Broker Count
Use the +/- buttons to increase the broker count above the calculated minimum. The utilization bars update in real time so you can see the impact:
- Green (< 60%) — comfortable headroom for growth
- Orange (60–80%) — running tight, plan for expansion
- Red (> 80%) — at risk, add brokers or upgrade hardware
This is useful for planning ahead. If you expect 2× traffic growth in the next year, bump the broker count until utilization drops to a comfortable level.
The per-broker stats line at the bottom shows exactly how much storage, network, and partition load each broker carries at your chosen count.
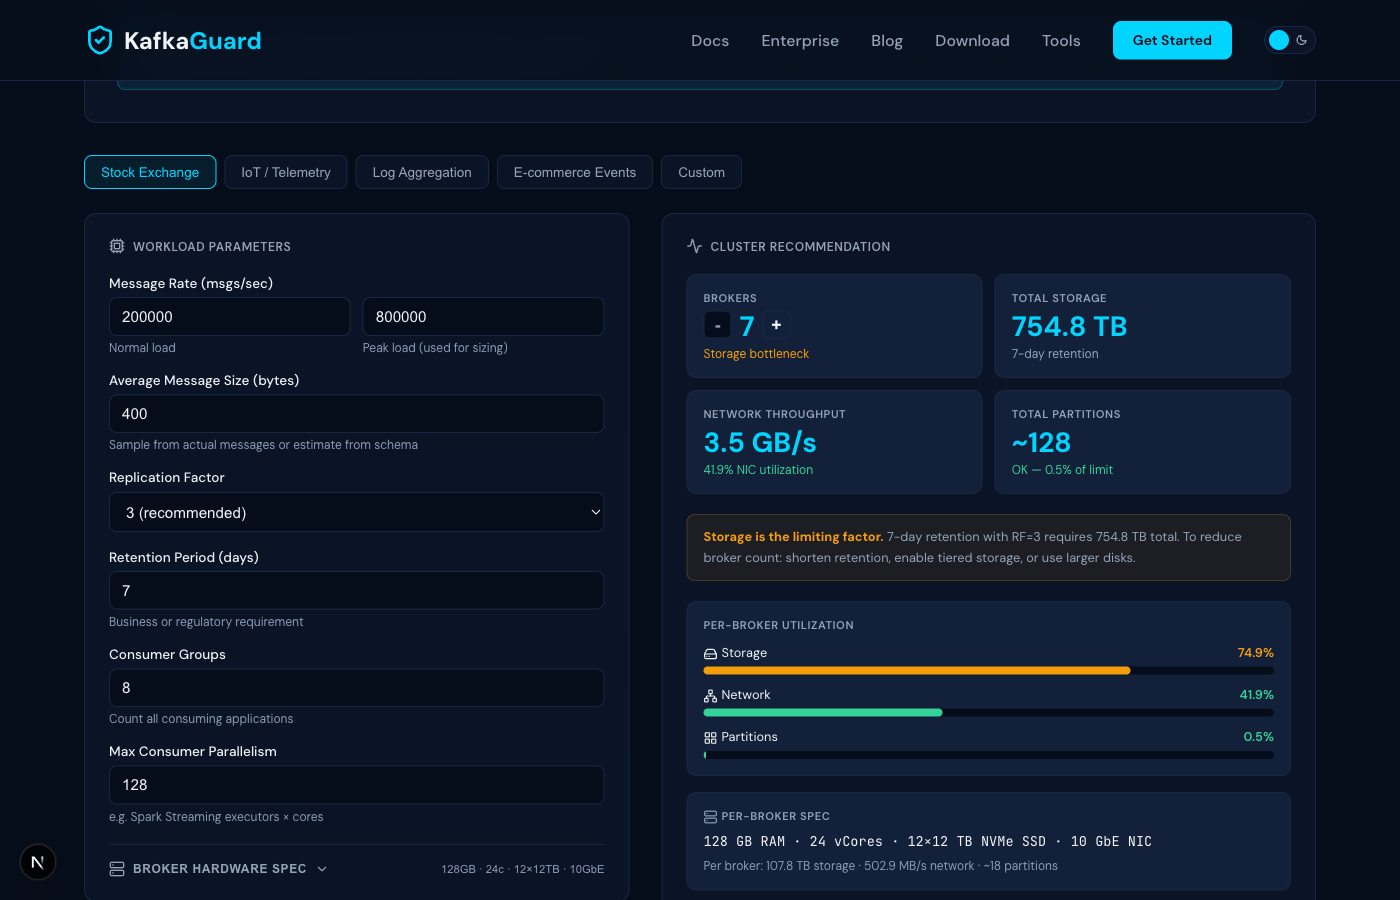
Real Example: Stock Exchange Cluster
Using the Stock Exchange preset (800K msgs/sec peak, 400 bytes, RF=3, 7-day retention, 8 consumer groups):
- Inbound throughput: 800K × 400 bytes = 320 MB/sec
- Replication traffic: 320 × 2 = 640 MB/sec
- Outbound traffic: 8 groups × 320 = 2,560 MB/sec
- Total network: 3,520 MB/sec (~3.5 GB/sec)
- Storage: ~737 TB with 30% headroom
- Result: 8 brokers — storage is the bottleneck at 64% utilization per broker
Pro Tips
- Always size for peak, not average. Kafka clusters that run fine at normal load can fall over during traffic spikes.
- The 30% storage headroom is already included in the calculator — don't add it again manually.
- Keep per-broker NIC utilization under 70%. The calculator enforces this in its throughput calculations.
- Rack awareness matters. If spreading across 3 availability zones, consider a broker count that's a multiple of 3.
- Run the calculation quarterly. Traffic patterns change. What was comfortable 6 months ago may be tight today.
Try It Now
Open the Kafka Capacity Planner and size your cluster in under a minute. No signup, no data collection — it runs entirely in your browser.